SBK-unexpected-data
Forewords
The SBK Datalogger generates CSV files that can be imported into spreadsheet (see this tutorial on Spreadsheet usage).
Upon condition, charting may reveal few data deviating from standard/common values.
This tutorial shows: why it happens, how to identify the data, how to fix it and what to do to avoids such situation.
The unexpected data
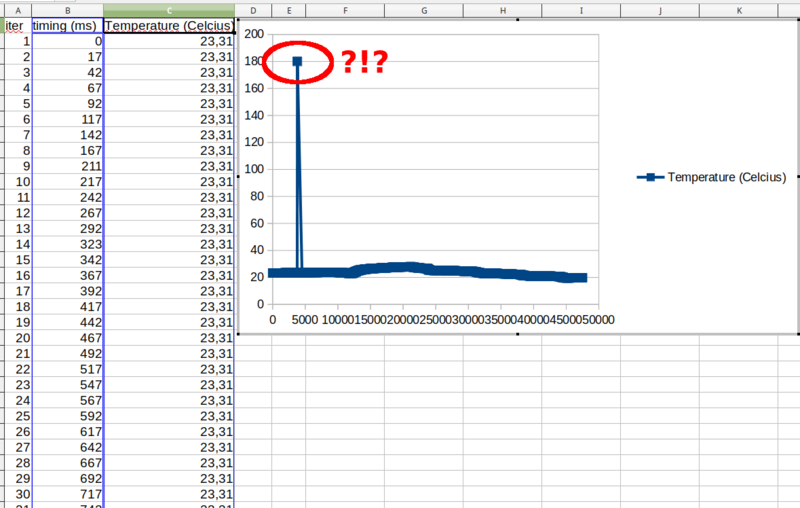
Drawing the data of the temperature sensor (content of the CSV) reveal an unexpected value.
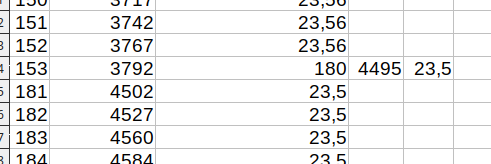
By exploring the spreadsheet data, we can locate the line where appears the 180 °C value.
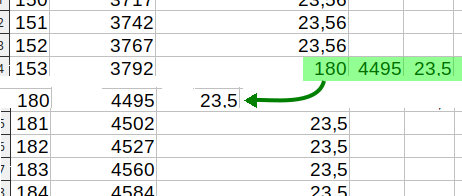
A close inspection reveal that "180" value is not a temperature but the next iteration number.
Conclusion:
- The iteration 153 as no value.
- The line of iteration 153 must be removed.
- Iteration 153 to 179 are missing (lot of data has not been logged).
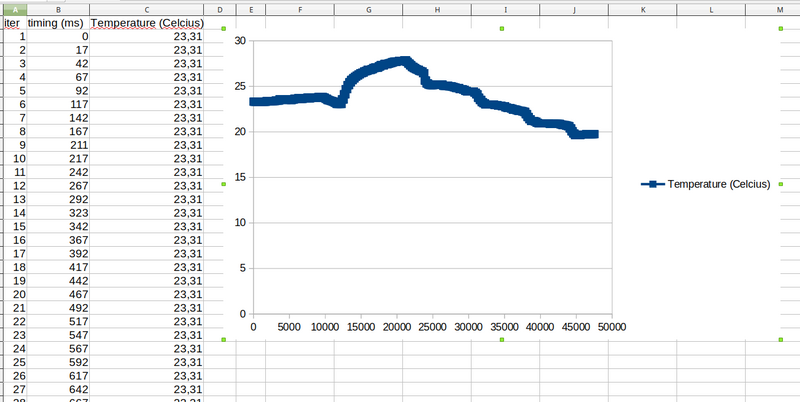
Once the CSV file modified, the new chart will be inline with expectations
Why this happens?
This may happens when collecting too much data (from too many sensors) with a too high sample rate (10 ms or burst).
To avoids that issue:
- Either reduce the collected data
- Either increase the sampling time (time between two successive samples)
Inside view
The sampling process does acquire the data as fast as possible to to respect the sampling time.
Then the data is pushed into a ring buffer for the sampling process to get ready for the next sample.
The main process --who's handle the LCD display and user input-- will then collect the data from the ring buffer then save it to the CSV file.
IF the data are pushed into the ring buffer faster that it is read from THEN some data will miss in the CSV file.
As carriage return is part of the data (going to the next line), concatenation of two lines may also appears in the CSV file.
Detect missing records
No data will be lost when using a sample time of 1 second or higher.
When sample time is under 1 second then record may be lorst when the DataLogger is pushed to the limit.
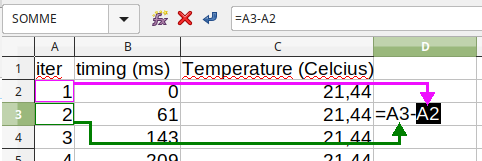
In a new column, append a formula that susbtract the previous row A column value to the current A column value.
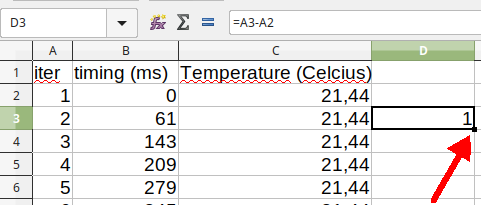
Double-click on the small dot to repeat the formula accross all the rows.
This formula should obviously returns 1 all along the column when all the rows are available in the file.
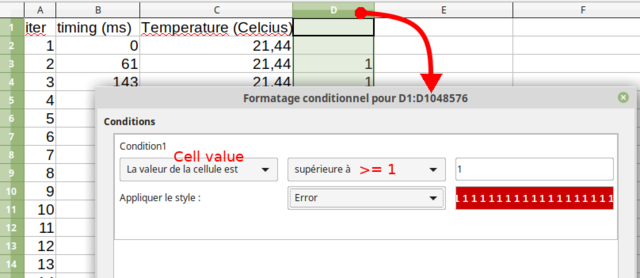
Click a the column header to select it (the D column in this example) then select the "Conditional formatting" tool.
Now, enter a rule that highlight the cell (in Red) when the value is greater than 1.
Written by Meurisse D. for MCHobby
